Supply in profit
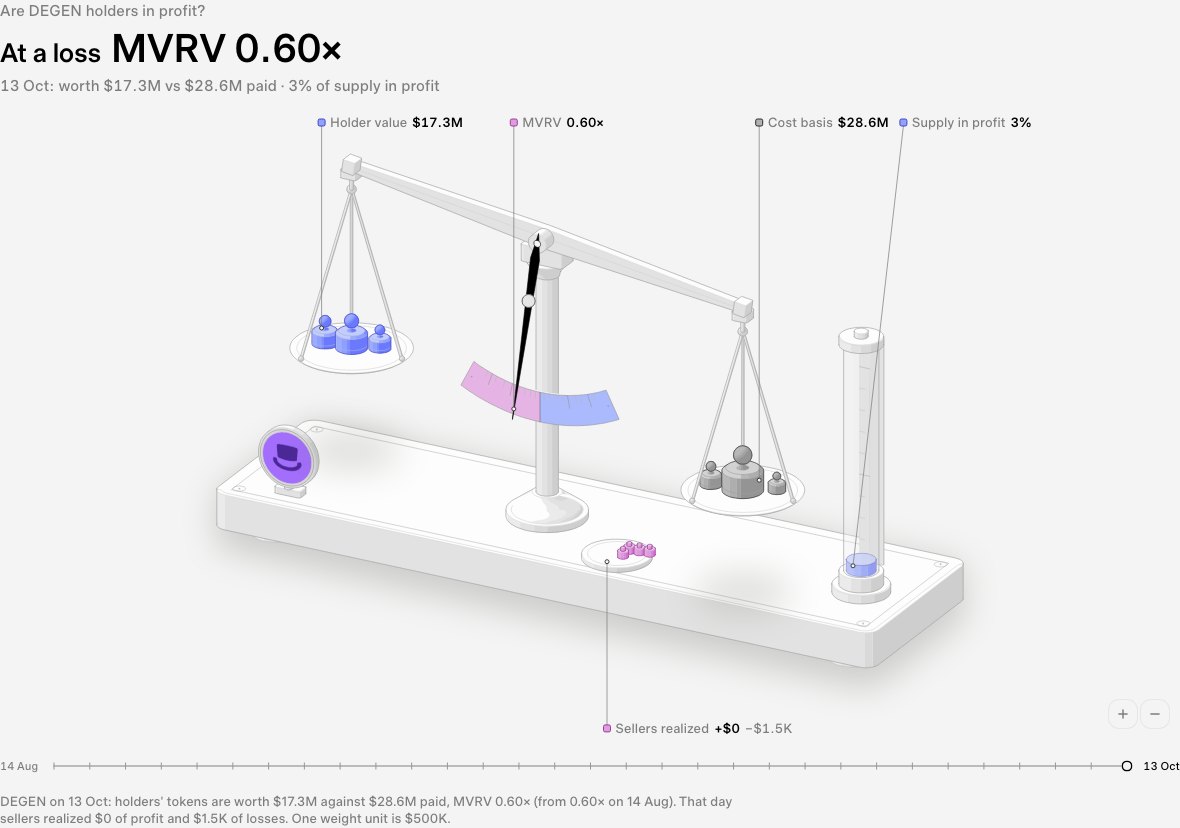
The share of held supply acquired below the day's price. The rest was acquired above it and sits at a loss.
Two piles. Every tracked token of DEGEN was acquired either below the day's price (in profit) or above it (at a loss). On 24 Oct: 352.13M tokens against 14.16B.
The real card
Supply in profit, live on DEGEN. Switch to any cached token.
Supply in profit
Put this card on a dashboard of your own, or get told when the figure moves
What it is
Supply in profit splits the tracked supply into two parts: tokens acquired below the day's price (in profit) and tokens acquired above it (at a loss). The share in profit is the first part as a percentage of both.
It counts tokens, not wallets.
The panel also counts wallets in profit and at a loss, and the two can tell different stories: a few early whales can hold most of the supply at a gain while most wallets are underwater.
In the snapshot of 11 Oct 2026 the median token had 13% of its supply in profit.
What goes into it
- 1
The panel stores the token amounts in profit and at a loss for each day it has computed, with wallet counts beside them. The card divides the first by the sum of both.
supply in profit % = tokens in profit ÷ (tokens in profit + tokens at a loss) × 100 - 2
The share also comes ready-made, so the two sides stack to exactly 100; the cost-basis balance's sight gauge reads it.
- 3
Supply includes exchange balances; wallet counts leave exchange wallets out. Missing days are gaps.
- 4
The market summary weights each token's share by its market cap; the snapshot keeps each token's latest share.
How to read it
- High
- Most of the supply sits on a gain. With almost all of it in profit the saturation rule counts it as bear evidence: nearly everyone has gains to take.
- Low
- Little of the supply sits on a gain. With almost none of it in profit, on a token that still trades, the exhaustion rule counts it as bull evidence: few holders have gains left to take.
- Rising
- More of the supply moves above its cost. Crossing above 50% after a stretch under it is the majority-regained rule.
- Falling
- More of the supply slides under its cost. Crossing below 50% after a stretch over it is the majority-lost rule.
Evidence in the data, never advice
Common pitfalls
- Share of supply is not share of wallets; the data table shows both counts.
- A missing day is a day not yet computed, not a day with nothing in profit.
- The panel can carry a partial row for the current UTC day.
See it on…
Where it stands out in the latest snapshot. Tokens under a $1M market cap are left out
Cards that show it
Drawn on DEGEN; open one on its page
Related
- Cost basis & profitMVRVHolder value divided by cost basis. Above 1 the average holder is in profit; below 1, at a loss.
- Cost basis & profitHolder value vs cost basisWhat current holders' tokens are worth against what those holders paid for them. The gap is their unrealised profit or loss.
- SignalsSignal family: profitabilityRules on the share of supply in profit: almost none (exhaustion), almost all (saturation), and the majority flipping.
- The gradeGrade pillar: economicsHolder economics: MVRV and the share of supply in profit, each against the fleet.
Every figure on this page comes from Blocktronics' stored, public reads. It describes what the data shows; it is not advice.