DEX netflow
Dollars bought minus dollars sold through the token's DEX pools, per day. Positive is net buying, negative net selling.
Buying. Dollars of DEGEN bought through its DEX pools each day: $5.4M over 59 days.
The real card
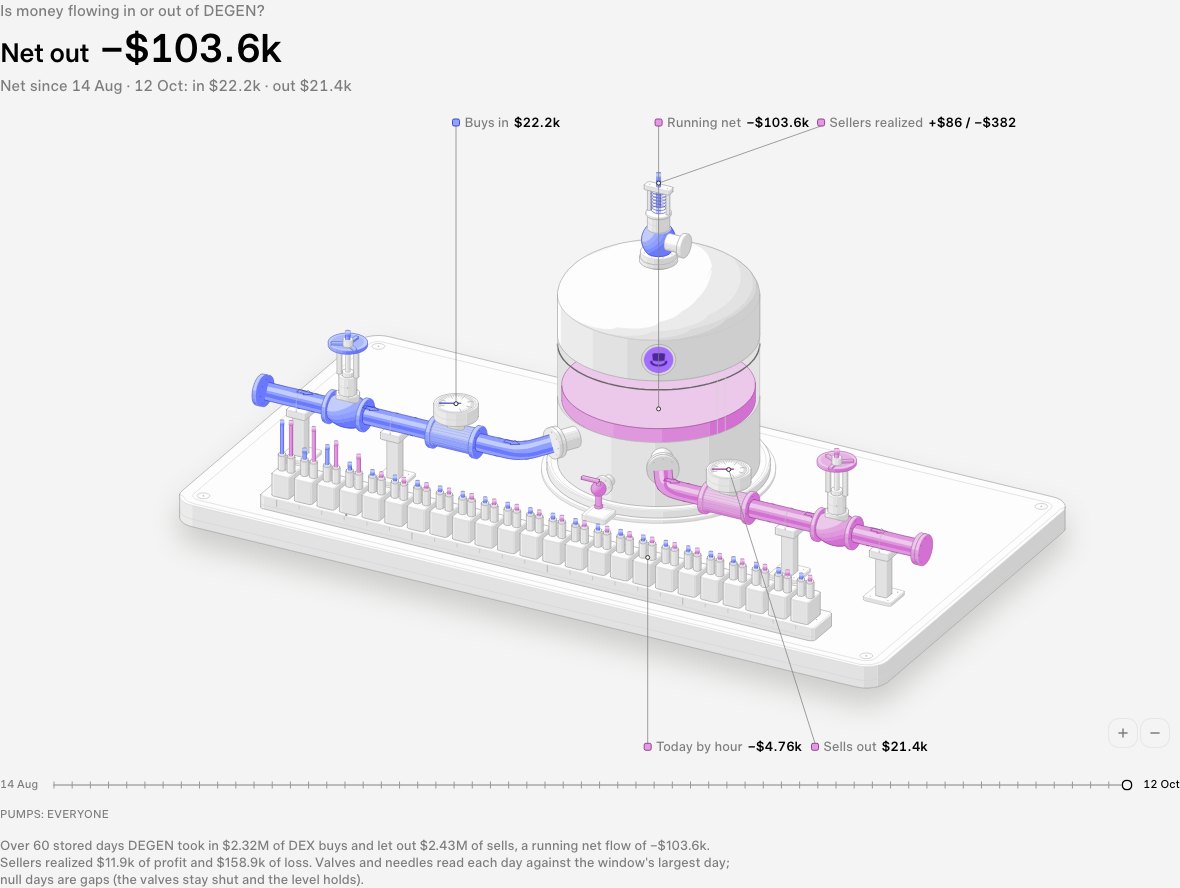
DEX netflow, live on DEGEN. Switch to any cached token.
DEX netflow
Net buying above the line in green, net selling below in red; each chain its own shade
Put this card on a dashboard of your own, or get told when the figure moves
What it is
Every swap in a token's decentralized-exchange pools is either a purchase of the token or a sale of it. DEX netflow adds up each day's purchases in dollars and subtracts the day's sales.
A positive day means more dollars came in through the pools than went out; a negative day the opposite.
Over weeks, the running total shows whether buyers or sellers have had the upper hand on-chain.
Centralized exchanges are not in it: this is what happened in the token's on-chain pools.
What goes into it
- 1
The panel stores one net figure per settled day: DEX buying volume minus selling volume in USD.
net flow = buying volume − selling volume (USD, per day) - 2
Daily shows each day as a bar from zero in its polarity. Running adds the days up from the window's first day; a missing day stays a gap and adds nothing.
- 3
The headline is the sum over the stored days, with how many of them were net buying.
headline = Σ daily net flow · net-buying days = days with net flow above 0 - 4
The snapshot keeps 7- and 30-day sums ending at the panel's own last day. Days with figures that can't be right are left out of the sums, and the sum says which day it leaves out ("excluding 15 Oct").
- 5
The market map colours each tile by its 7-day sum as a share of market cap, on a scale centred on a neutral 0 and set by the tokens in view; its legend prints where the scale ends. Tiles past it take the full colour; a tile without a reading stays gray.
How to read it
- High
- Large net buying through the pools. On its own one big day can be a single wallet.
- Low
- Large net selling through the pools.
- Rising
- Days turning from net selling to net buying. A run of settled days in a row of net buying is the buying-streak rule.
- Falling
- Days turning to net selling. Most of the last 30 days net selling with the month clearly net negative is the steady-selling rule.
Evidence in the data, never advice
Common pitfalls
- Net is not volume: a quiet day and a busy, balanced day both net near zero. Read it beside the volume card.
- Many small buying days can be outweighed by a few large selling days; the selling-into-strength rule looks for exactly that.
- Flow rules stay quiet on thinly traded tokens.
- Dollar values are at the time of each swap.
See it on…
Where it stands out in the latest snapshot. Tokens under a $1M market cap are left out
Largest net buying, 7 days
Largest net selling, 7 days
Cards that show it
Drawn on DEGEN; open one on its page
Related
- FlowsBuying and selling volumeDollars traded through the token's DEX pools each day, split into purchases and sales, with how many swaps made them.
- Using BlocktronicsCalendar viewsDays as a grid of squares, coloured by size and sign: deeper colour for bigger days, in four steps either way.
- Smart moneySmart money netflowNet buying by the wallets Blocktronics flags as proven smart money, in dollars per day: accumulating above zero, distributing below.
- SignalsSignal family: flow and venueRules on DEX flows: streaks, steady buying or selling over a month, size against the crowd, swap counts and today's bursts.
- The gradeGrade pillar: flowCapital flow: 30-day net flow as a share of market cap, and the share of days that were net buying.
Every figure on this page comes from Blocktronics' stored, public reads. It describes what the data shows; it is not advice.