Supply concentration and top-10 share
Share of supply held by the 10, 50 and 100 largest holders. Exchange and other infrastructure wallets are left out.
Top 10. The share of DEGEN's supply held by its ten largest wallets, with exchange and other infrastructure wallets left out: 35.2% on 29 Oct.
The real card
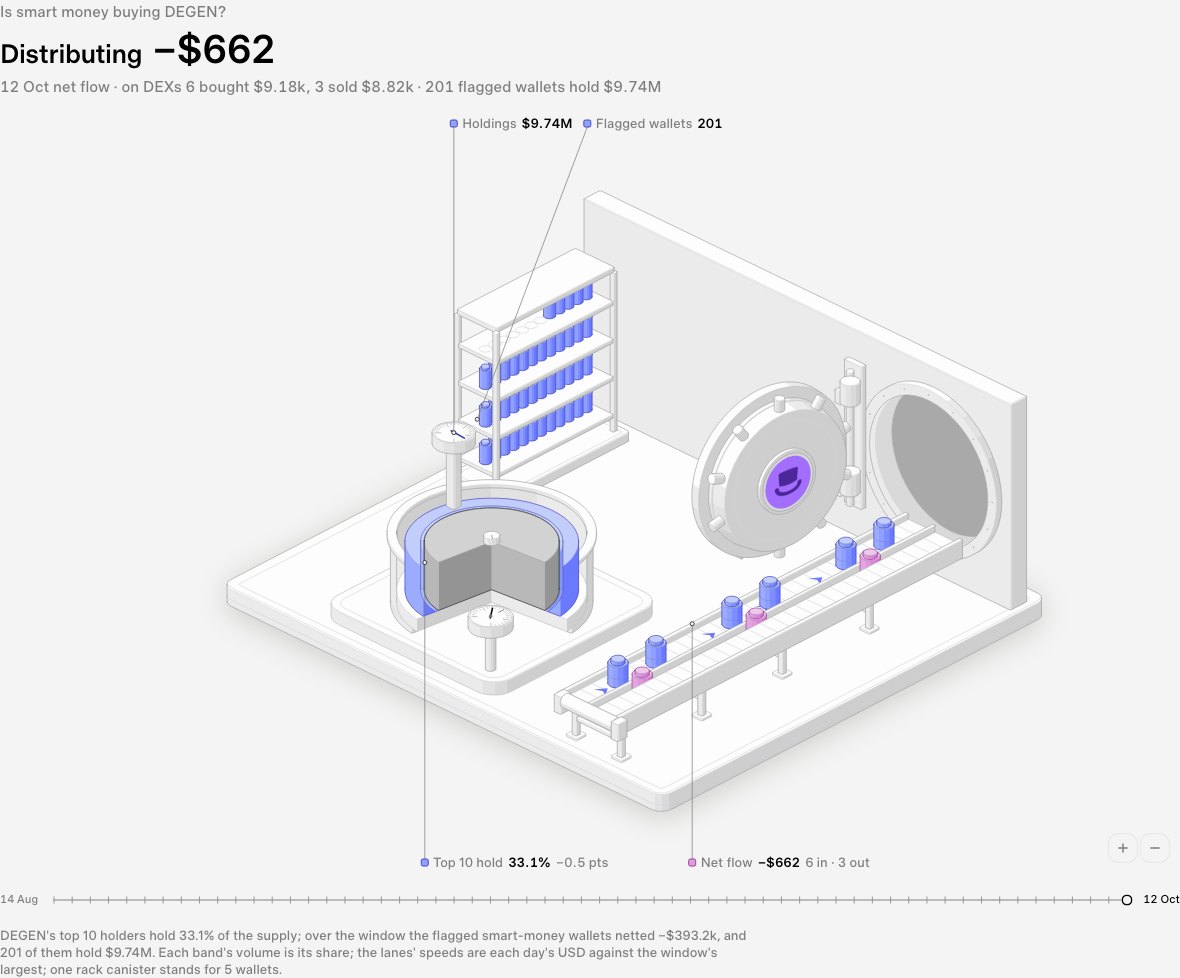
Supply concentration, live on DEGEN. Switch to any cached token.
Supply concentration
Put this card on a dashboard of your own, or get told when the figure moves
What it is
Concentration measures how much of the supply the largest holders control.
The headline is the top-10 share: the percentage of the supply held by the ten largest wallets.
Infrastructure wallets are left out first. Leaving an exchange wallet in would count thousands of customers as one giant holder and distort every share.
The card shows the latest day as rings of holder rank (the top 10, ranks 11 to 50, 51 to 100 and everyone else) and the top-10, top-50 and top-100 shares as daily lines.
What goes into it
- 1
Each stored day carries the top-10, top-50 and top-100 shares (percent of supply), and the bands between them.
ranks 11–50 = top 50 − top 10 · ranks 51–100 = top 100 − top 50 · everyone else = 100 − top 100 - 2
The supply layers (3D) stand a slab per day, its four bands stacked from zero to the whole supply with the top 10 at the bottom, so a layer thickening along the block is that group holding more and the layers' edges are the top-10, top-50 and top-100 shares.
- 3
The change is the top-10 share's move from the first to the last stored day, in percentage points. The key figure and the card both show it.
How to read it
- High
- A few wallets hold much of the supply: their decisions move the market more, and the grade's concentration pillar reads it as structural risk.
- Low
- The supply is spread across many holders.
- Rising
- The largest wallets are adding. The signal rules count it as bull evidence (size accumulating); the card marks it in the negative colour, because concentration risk grows.
- Falling
- The largest wallets are letting supply go to the rest of the market. The card marks a falling share in the positive colour; the rules count it as bear evidence.
Evidence in the data, never advice
Common pitfalls
- The two colourings answer different questions: the card's colour is about structural risk (less concentration is better), the signal rule's direction is about who is accumulating.
- A one-day step of many points is usually a reclassification, not trading.
- Shares are of the tracked supply after infrastructure is excluded, so they are not the same as a block explorer's top-holders list.
See it on…
Where it stands out in the latest snapshot. Tokens under a $1M market cap are left out
Least concentrated
Cards that show it
Drawn on DEGEN; open one on its page
Related
- HoldersHolder cohorts: shrimp to whaleWallets in four exclusive size bands: shrimp $5–1k, lobster $1k–10k, dolphin $10k–100k and whale $100k+.
- The gradeGrade pillar: concentrationOwnership concentration: the top-10 share and its trend, with a note on any proven smart money among the top 10.
- SignalsSignal family: ownership migrationRules on who holds: whales against shrimp, the holder base growing or shrinking, the top-10 share moving.
- Smart moneyFlagged wallets and their holdingsHow many flagged smart-money wallets hold the token, and what their holdings are worth in dollars.
Every figure on this page comes from Blocktronics' stored, public reads. It describes what the data shows; it is not advice.